In this video, we will show you several ways in which you can generate custom reports using QAAPT. You can use these functions to conduct further analysis beyond the automatic analyses presented on the Dashboard. The QAAPT analyses should be taken as an example and reference, and we recommend consulting microbiologists and AMR experts in your circle to better understand the relevance and credibility of such analyses.
QAAPT can help you generate custom reports for analyses that include:
- Antimicrobial Pattern Analysis
- Antimicrobial Susceptibility Trends Analysis
- Hospital Antibiogram
- Antibiogram by Organism
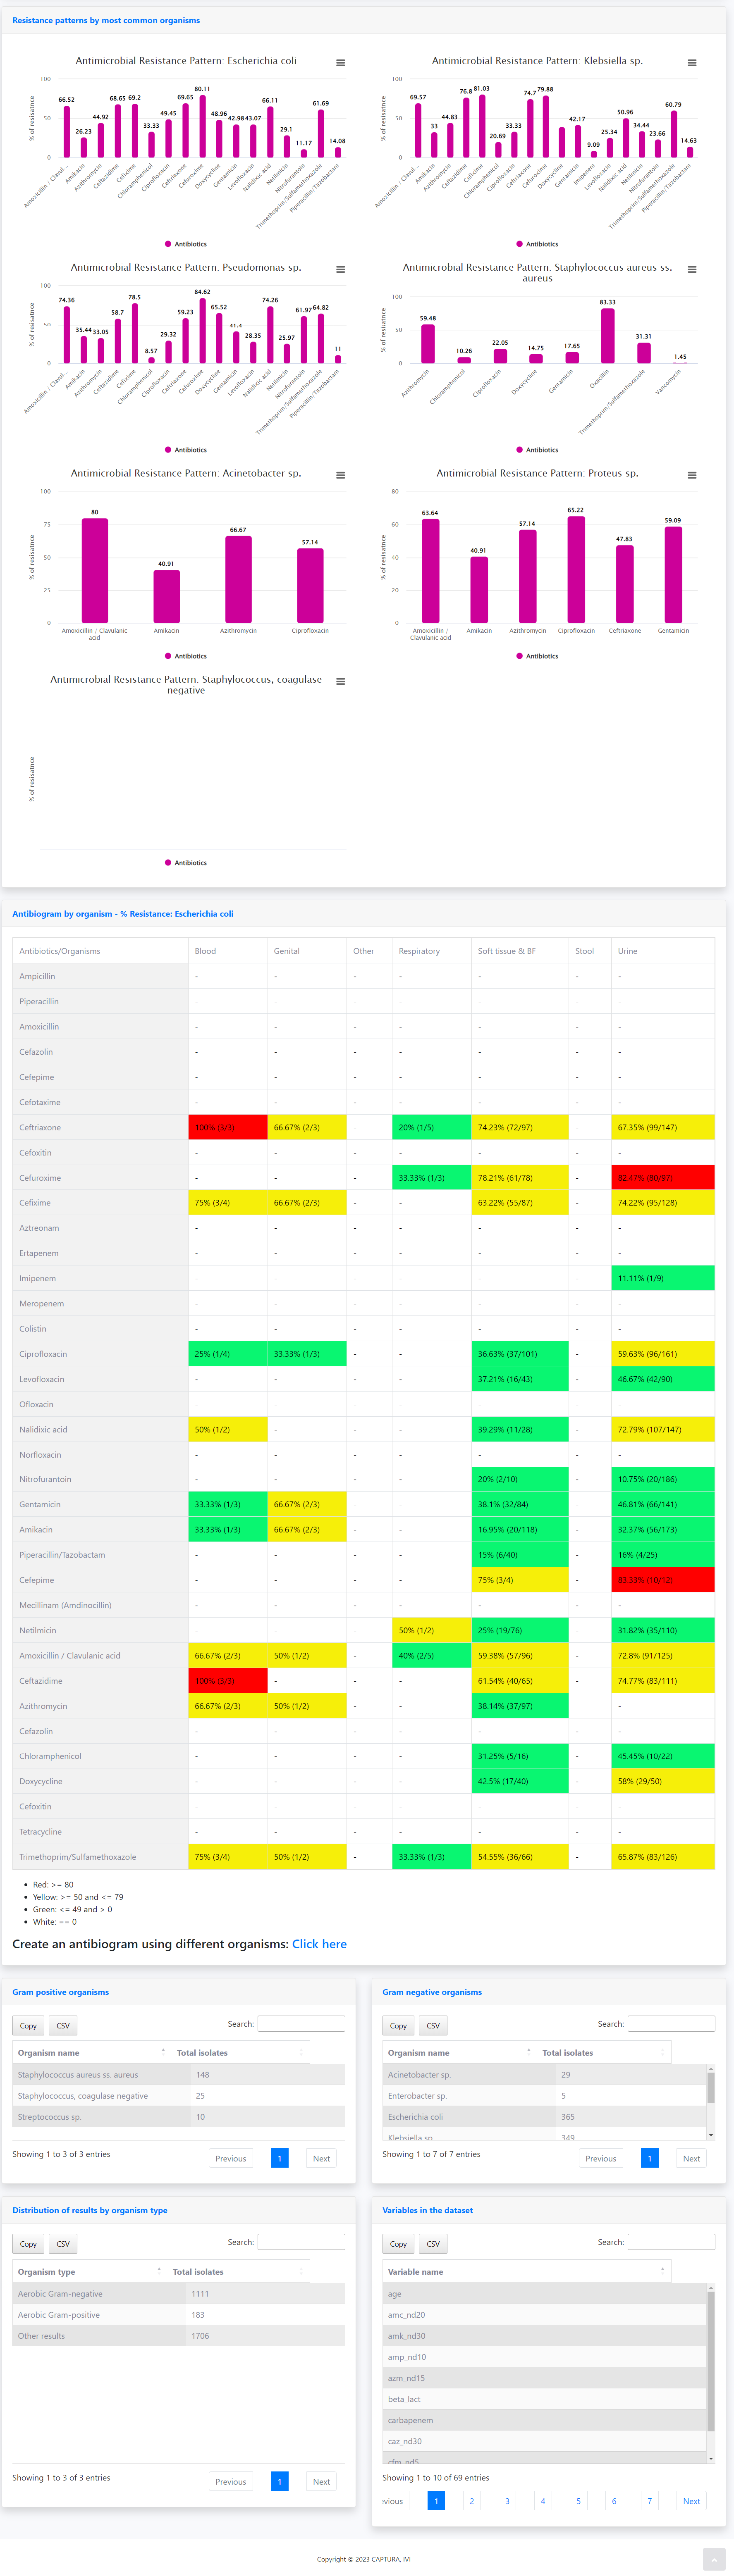
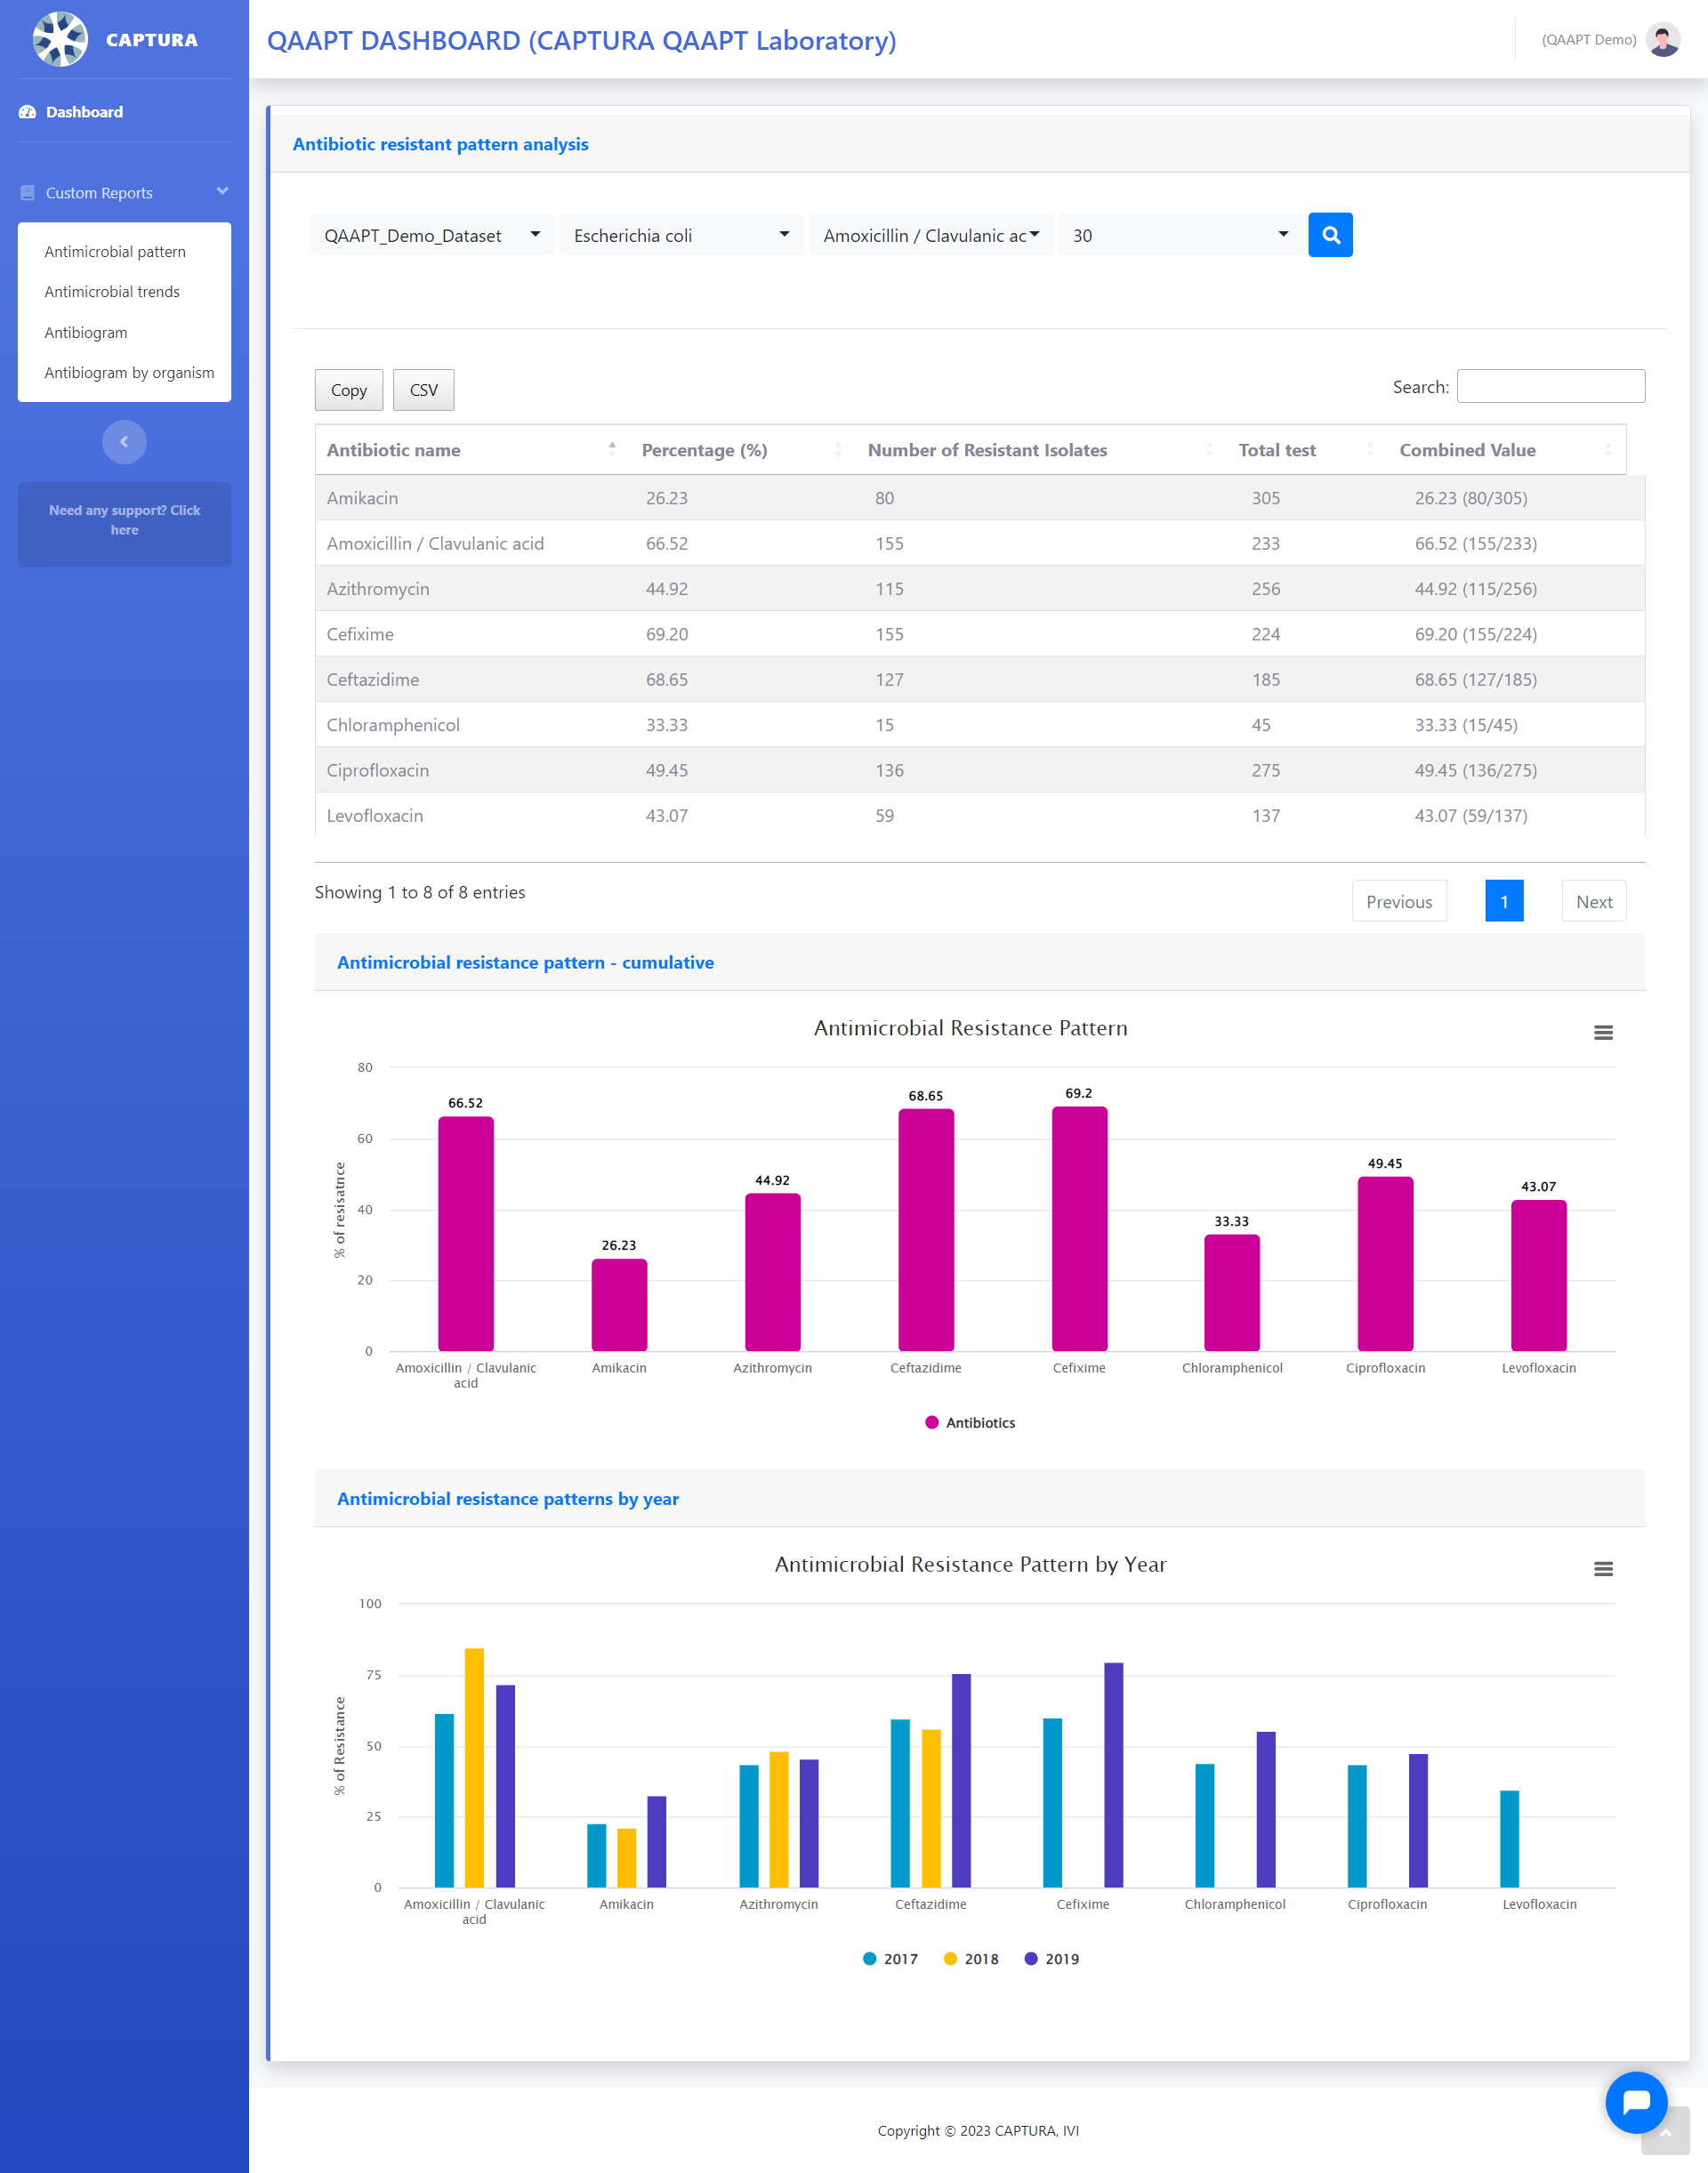
First, we will dive into Antimicrobial Pattern Analysis. The Antimicrobial Pattern analysis report can help you analyze the antimicrobial patterns according to organism.
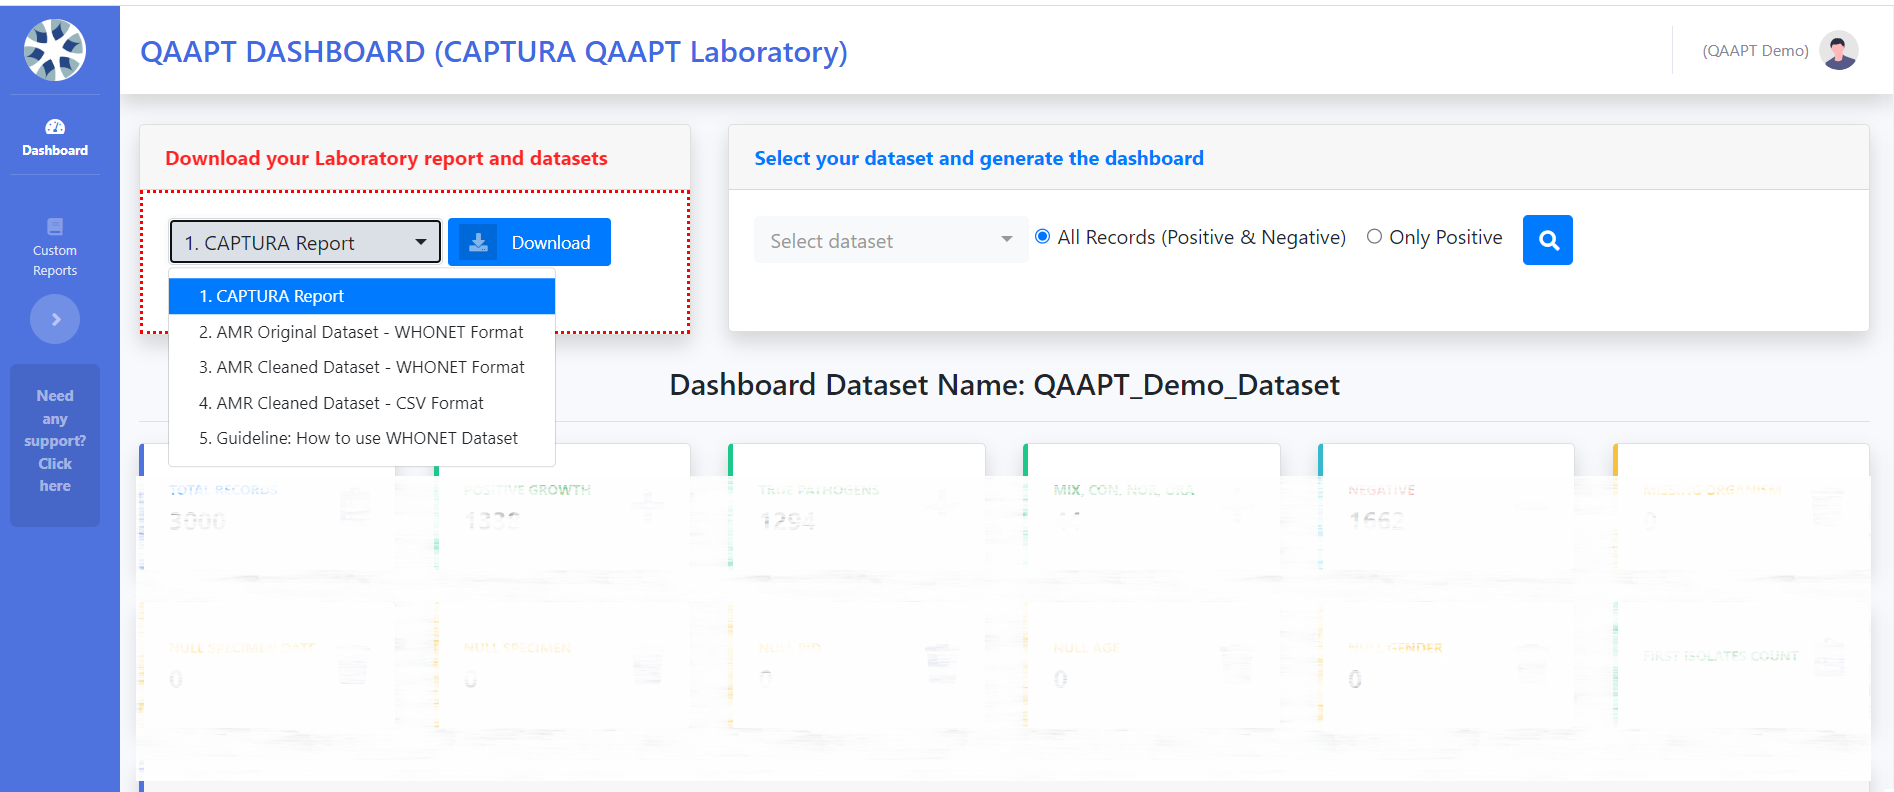
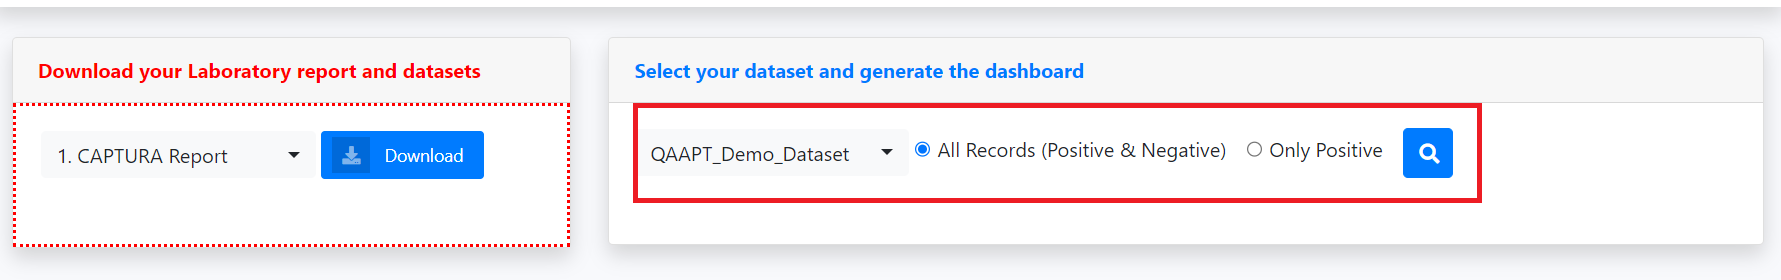
- First, select a data set in the first drop-down menu
- The second dropdown will populate the list of top organisms. Please select only one organism here
- Select the antibiotics you’re interested in
- You can change the threshold 30 to any other values; it means the minimum isolates per test is 30 and click on the search button
This will generate three result figures:
- A table with antibiotics, percentage of resistance, number of tested resistance and number of total test for the organisms
- Cumulative resistance pattern with bar graph
- Pattern by year
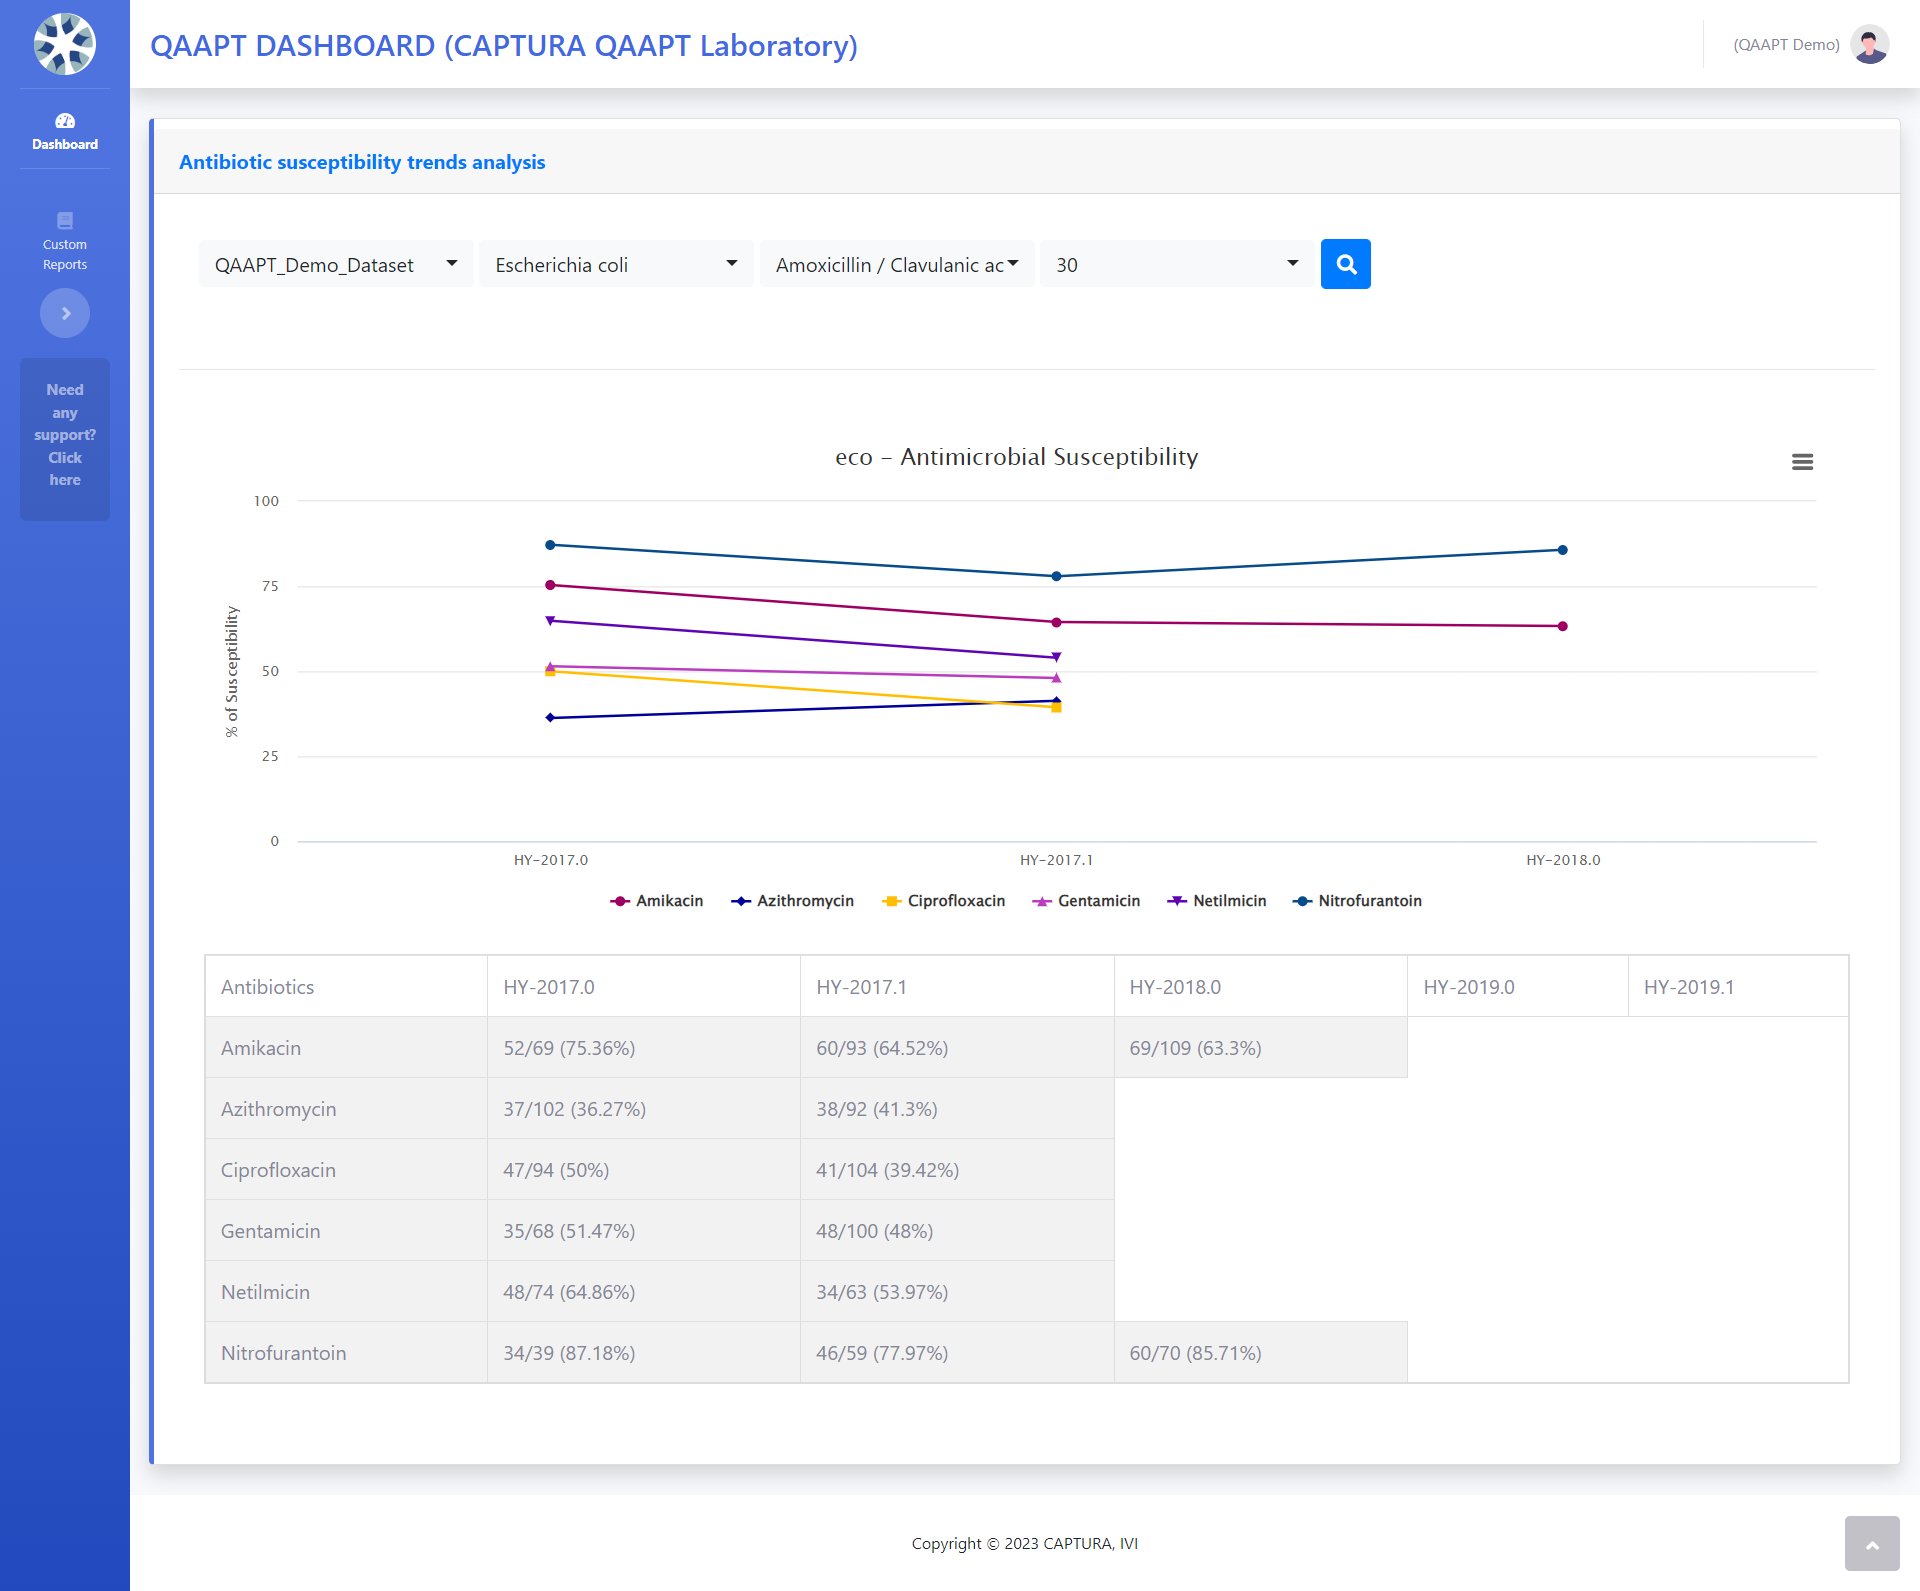
The next custom report you can generate with QAAPT is Antimicrobial Susceptibility Trends Analysis . This report will show you the half-yearly proportion of susceptibility by organism.
- First, select a dataset of interest
- The second dropdown will populate the list of top organisms. Please select only one organism here
- Select the antibiotics you’re interested in
- You can change the threshold 30 to any other values; it means the minimum isolates per test is 30 and click on the search button
This will generate two results figures:
- Susceptibility trends line graph by half yearly trends, and
- Two-by-Two table with % susceptibility, numerator and denominator
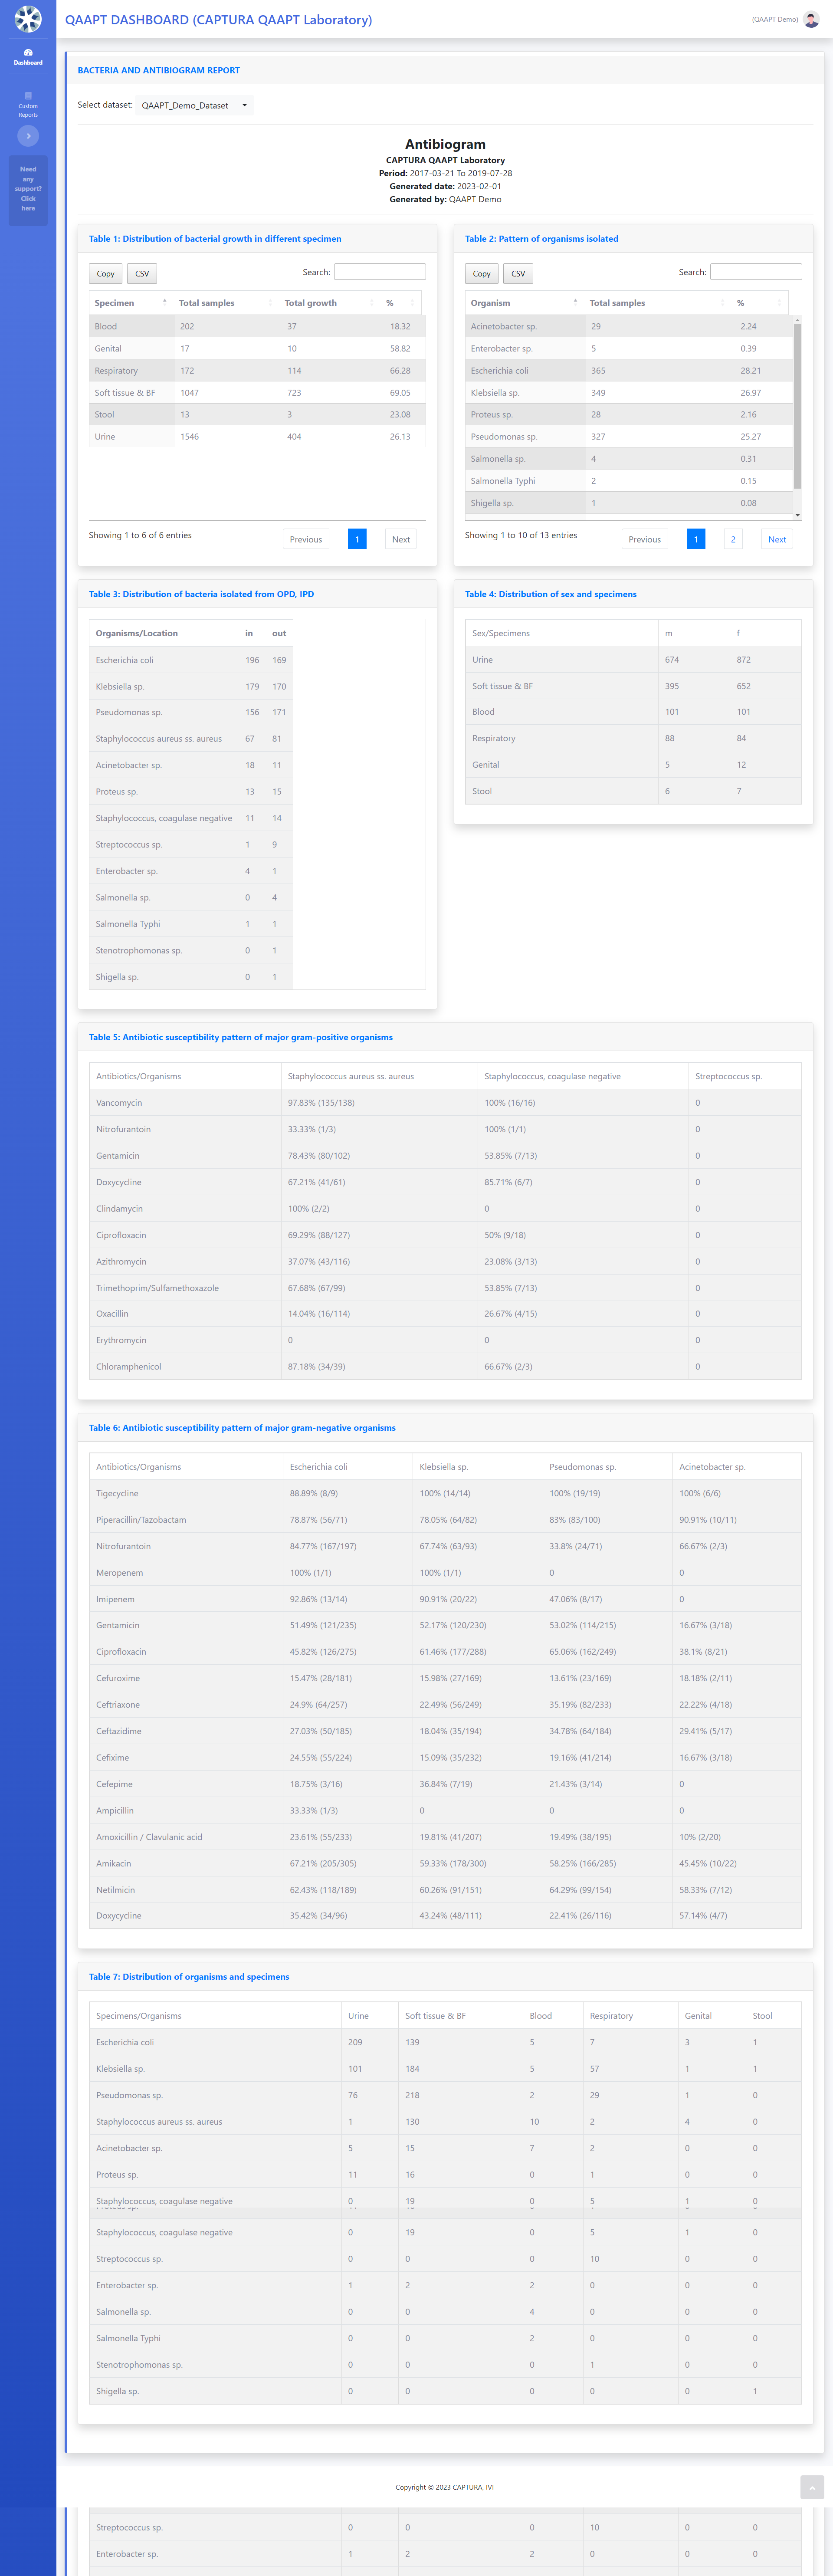
Next, we will show you how to generate antibiograms, using QAAPT. You can understand the patterns of resistance in organisms of your choice using this function.
- First, select your dataset from the drop-down menu and it will generate the report automatically
This report will help you generate your hospital antibiogram with following tables:
- Distribution of Bacterial growth in different specimen
- Pattern of organisms isolated
- Distribution of bacteria Isolated from OPD, IPD
- Distribution of sex and specimens
- Antibiotic susceptibility pattern of major gram-positive organisms
- Antibiotic susceptibility pattern of major gram-negative organisms
- Distribution of organism and specimens
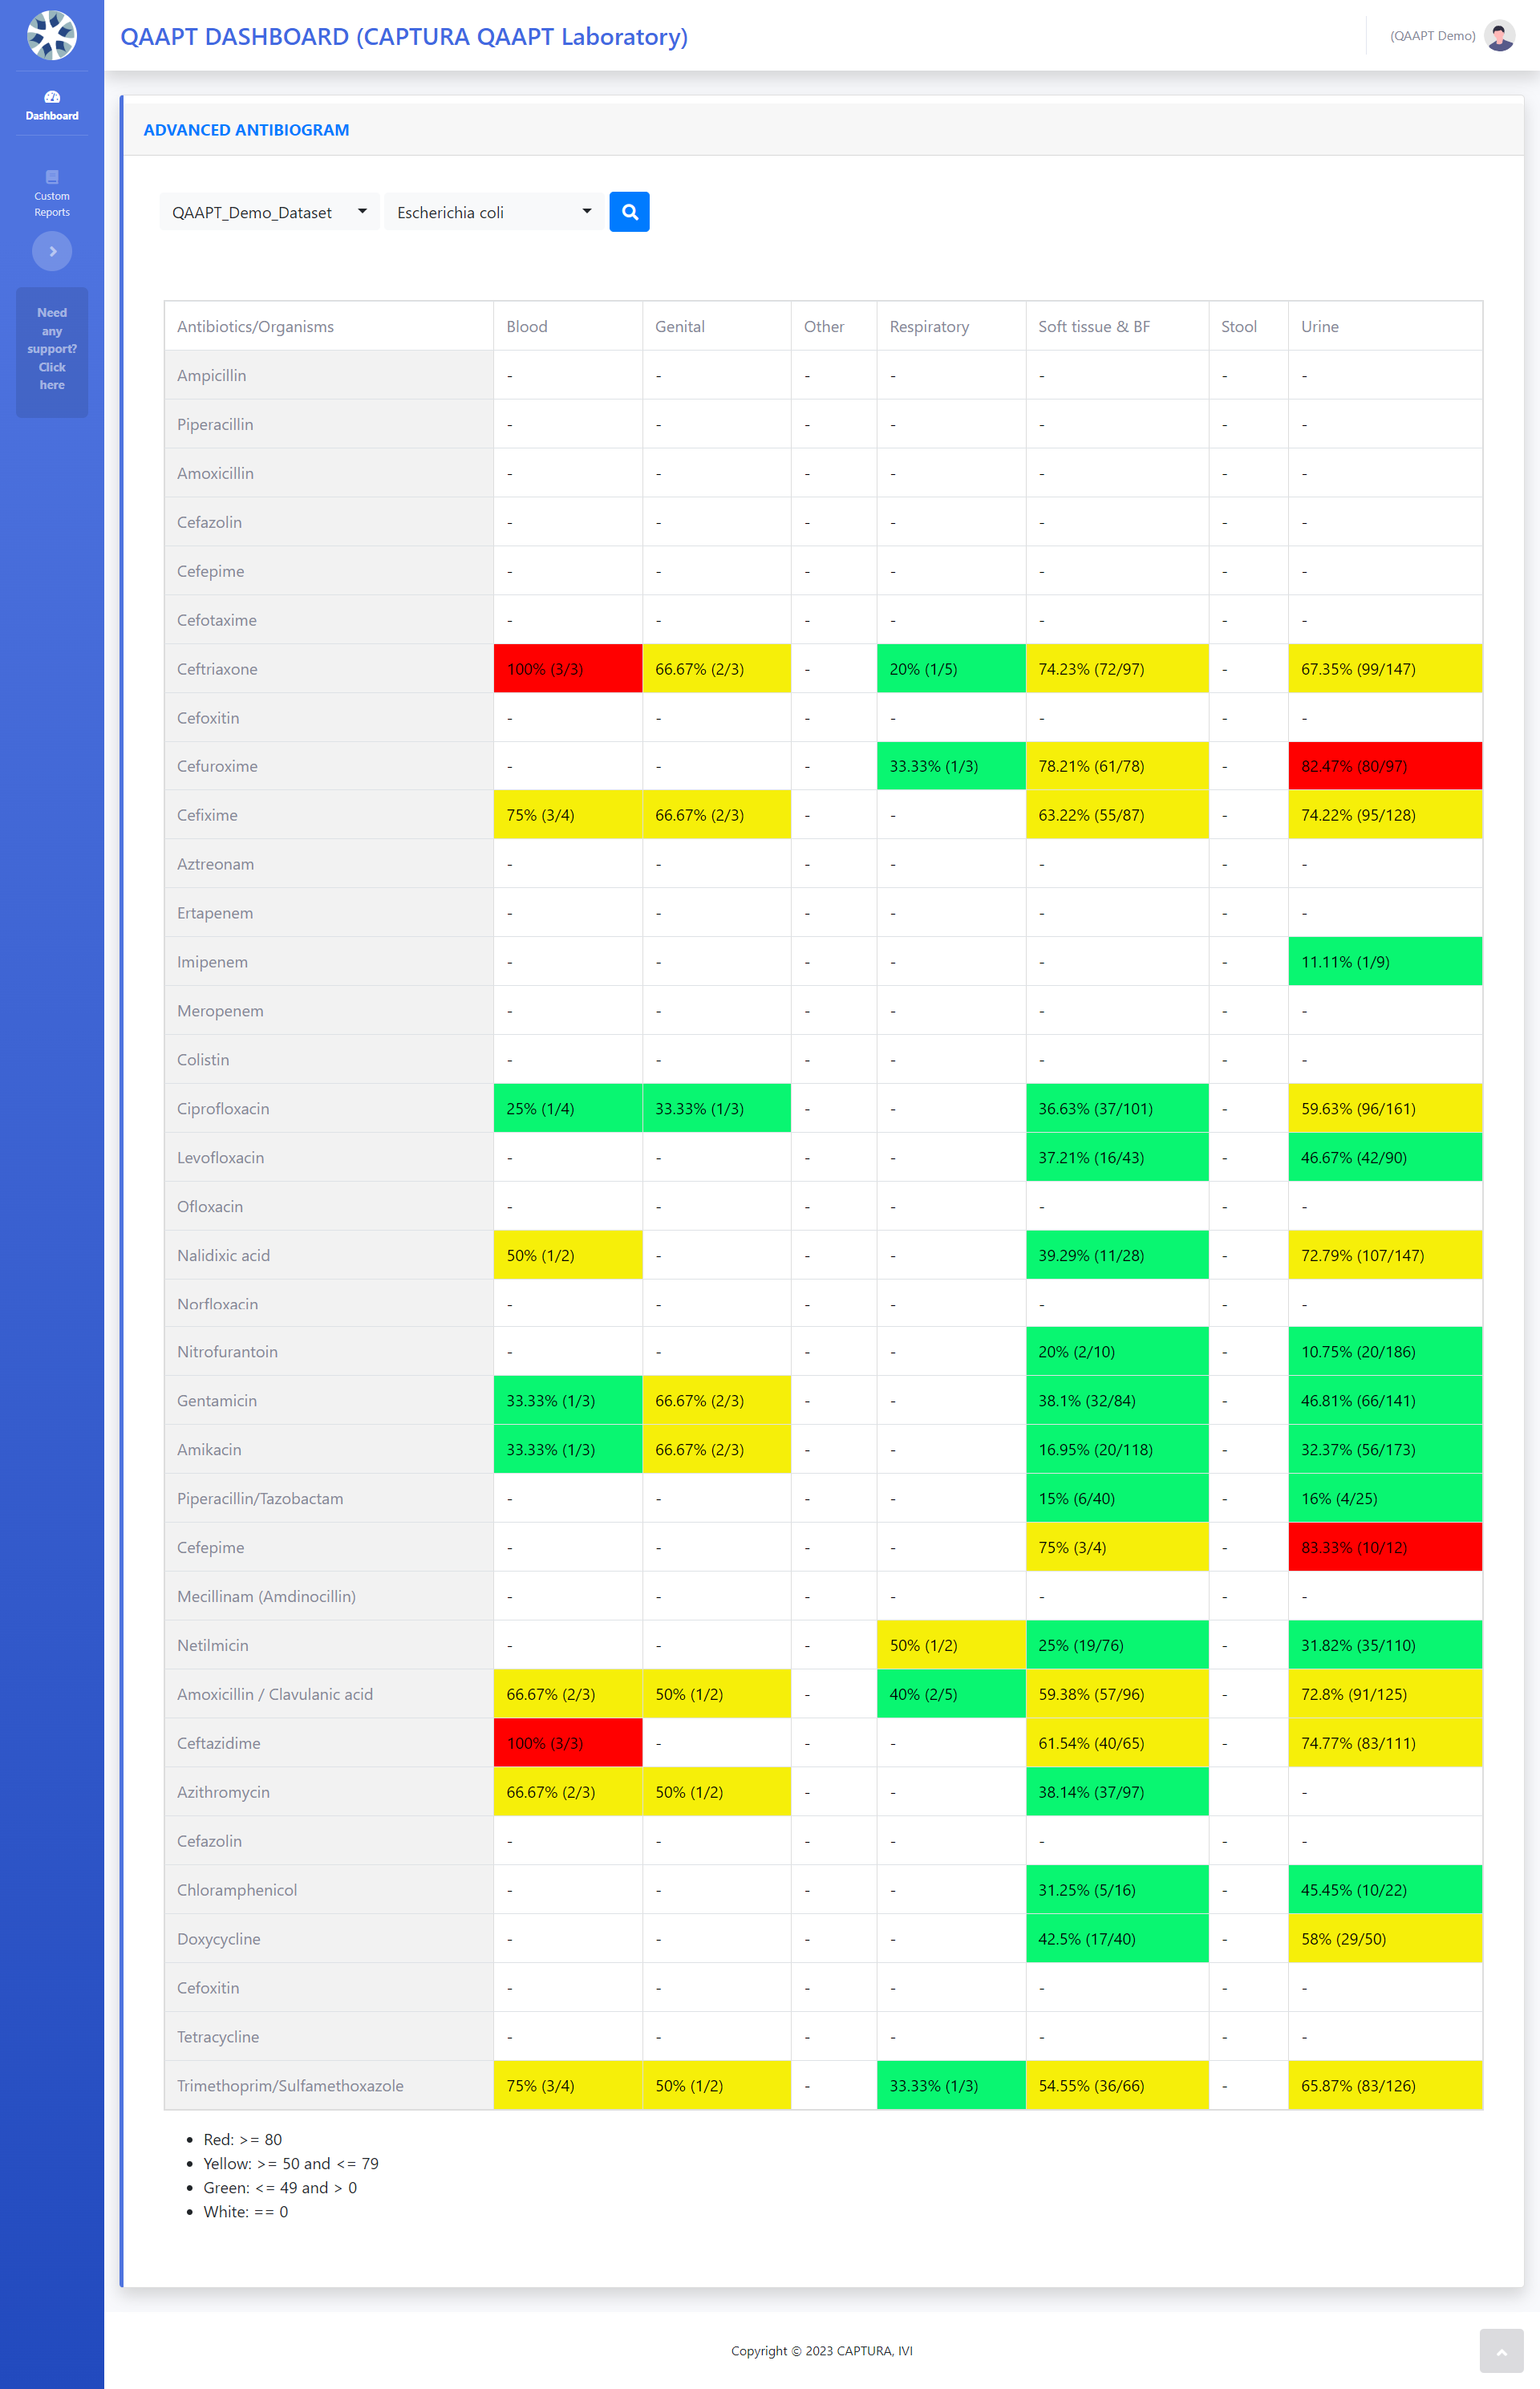
Lastly, we will show you how to generate antibiogram by organism using QAAPT.
First, in the first drop-down menu, select the dataset of your interest. Next, in the second drop-down menu, choose which organism you’re interested in.
This will generate a table that shows specimen by antibiotic antibiogram. the percentage of resistance, numerator, and denominators can be seen in the following table using the color codes.
That brings us to the end of QAAPT tutorial videos. If you would like to learn about how you can use WHONET to analyze your own data, please watch the videos below.